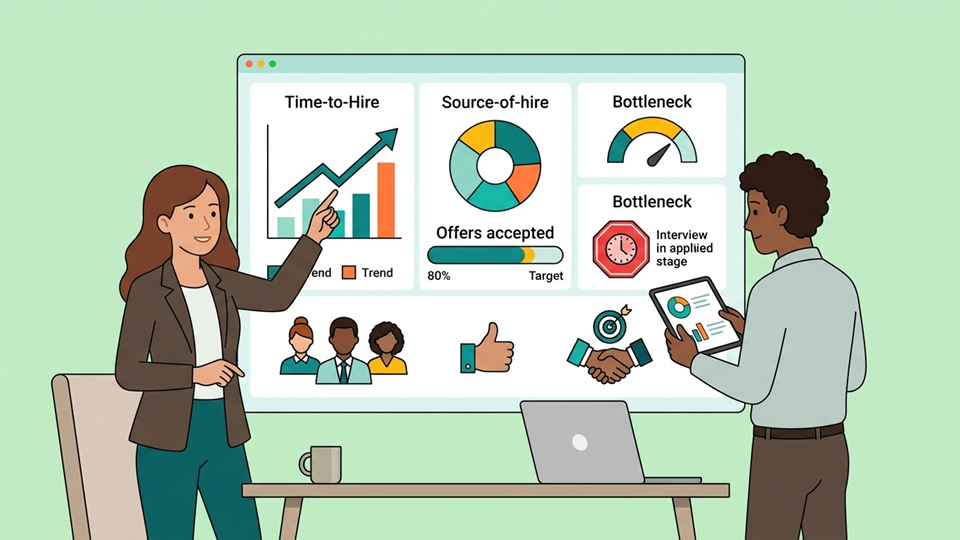
Start with executive decisions, not recruiting data
Recruitment dashboards often fail because they are designed around the information available in the recruiting system rather than the decisions executives need to make. Application counts, interviews scheduled, candidate sources, recruiter activity, and pipeline stages may all be useful operationally, but presenting every available metric to leadership usually creates noise rather than insight.
An executive recruitment dashboard should answer a smaller set of business questions. Can the company hire the people required to deliver its plans? Where are hiring targets at risk? How quickly is talent entering the organization? Which roles or departments are creating bottlenecks? Are offers competitive? Is recruitment spending producing results? Are hiring outcomes improving or deteriorating?
This changes the design of the dashboard. Instead of starting with a list of metrics, begin with the decisions leadership regularly makes. A growing company might need to know whether engineering hiring can support a product expansion. A hospitality business preparing for a seasonal peak may care more about hiring volume and time to productivity. A professional services company may focus on specialist vacancies that remain open long enough to affect revenue-generating capacity.
Context is equally important. Reporting that the company has 42 open positions means little without knowing whether that represents normal demand, rapid expansion, or an accumulating backlog. Showing that median time to hire is 38 days becomes more useful when the dashboard also shows a target of 32 days, a previous-quarter result of 34 days, and the departments responsible for most of the increase.
The best executive dashboards therefore combine current performance, targets, historical trends, and exceptions. Executives should be able to understand the state of recruitment quickly and then investigate the areas that require attention without navigating through dozens of unrelated charts.
Choose metrics that connect recruitment with business performance
A focused dashboard might begin with six to ten headline metrics. Open vacancies, hires against plan, time to hire, time to fill, offer acceptance rate, qualified candidates per vacancy, recruitment cost, and early retention provide a stronger executive view than dozens of activity measures. The exact selection should reflect the organization's hiring model and strategic priorities.
Hiring progress against plan is particularly valuable. Instead of showing only that 75 people were hired this quarter, compare actual hiring with the approved workforce plan. If the business expected 90 hires, leadership immediately sees a 15-person gap. Breaking that variance down by department can reveal whether the problem is concentrated in engineering, sales, operations, or another function.
Time metrics require careful definition. Time to hire commonly measures the period from a candidate entering the recruitment process until accepting an offer, while time to fill can measure the period from opening or approving a vacancy until it is filled. Both can be useful, but they answer different questions. Consistent definitions matter more than choosing one universal formula.
Offer acceptance rate is another strong executive indicator because it connects recruitment activity with market competitiveness. Suppose a company issued 60 offers and 45 were accepted, producing a 75 percent acceptance rate. If the previous quarter achieved 88 percent, leadership has a clear reason to investigate compensation, benefits, decision speed, employer positioning, candidate experience, or competing offers.
Pipeline health provides an early warning before missed hiring targets become visible. A company may have 30 engineering vacancies and appear on track based on recent hiring, but if only eight candidates are currently in final-stage interviews, future performance may be at risk. Showing candidate coverage by critical stage helps leadership distinguish between current results and future capacity.
Quality should not disappear from the dashboard simply because it is harder to measure. Early retention, probation completion, hiring manager satisfaction, or first-year performance can provide useful signals. These metrics should be interpreted carefully, since recruitment is not the only factor affecting employee success, but they prevent the organization from optimizing exclusively for speed and volume.
Design the dashboard around trends, exceptions, and segmentation
Executives rarely need to inspect every recruitment metric every day. They need to recognize changes quickly. Trend lines, comparisons with previous periods, targets, and clearly identified exceptions are therefore more valuable than isolated numbers. A time-to-hire figure of 41 days may be acceptable or concerning depending on whether it has fallen from 52 days or risen from 30.
Segmentation transforms averages into actionable information. Company-wide time to hire may be 36 days, while engineering takes 58, sales 29, and operations 21. The overall average hides the business problem. The same principle applies to offer acceptance, sourcing effectiveness, candidate withdrawals, cost per hire, and vacancy aging.
Vacancy aging is particularly useful for leadership because long-open roles often represent business risk. Instead of showing only the average number of days vacancies remain open, group positions into ranges such as less than 30 days, 30 to 60 days, 61 to 90 days, and more than 90 days. Leadership can then see immediately whether difficult vacancies are accumulating.
Source data should focus on outcomes rather than volume. A job board that generates 4,000 applications may appear highly productive, but if it produces only five hires while employee referrals generate 20 hires from 200 candidates, the business value is very different. Executive reporting should prioritize qualified candidates, interviews, hires, quality indicators, and cost rather than raw application totals.
Drill-down capability can keep the main dashboard simple without sacrificing detail. An executive may see that offer acceptance has fallen to 72 percent and then filter by department, region, recruiter, or job category to locate the issue. The first screen communicates the business signal, while deeper analysis supports diagnosis.
Visual discipline matters as well. Too many charts, colors, gauges, and tables make dashboards harder to interpret. Each component should answer a recognizable question, and similar metrics should use consistent formats. A dashboard should not require an executive to remember whether green represents candidates in one chart, departments in another, and performance against target elsewhere.
Make data trustworthy, current, and capable of driving action
Executives stop using dashboards quickly when they discover that the numbers cannot be trusted. Recruitment teams therefore need consistent definitions for stages, dates, candidate statuses, sources, hires, withdrawals, and rejected applications. If recruiters use pipeline stages differently or leave records incomplete, sophisticated visualization will not solve the underlying data problem.
Metric definitions should be documented. For example, does time to fill start when a manager requests a position, when finance approves it, or when the vacancy is published? Does an internal transfer count as a hire? Is an accepted verbal offer sufficient, or does the metric require a signed contract? Small differences can produce significantly different results at scale.
Freshness matters too. A dashboard presented as a live operational view should not depend on spreadsheets manually updated once a month. Automating reporting from the recruitment system reduces administrative effort and gives leadership access to current information. Monthly or quarterly snapshots can still be useful for formal reviews, but they should ideally come from the same underlying definitions and data.
Every important metric should also have an implied action. If vacancy aging increases, leadership may need to reconsider requirements, compensation, sourcing investment, or recruiter capacity. If offer acceptance falls, the business may review salary competitiveness or decision delays. If a particular source produces large numbers of applications but few qualified candidates, spending can be redirected.
A useful executive review might therefore focus on five questions: where hiring is behind plan, which critical vacancies are aging, where the pipeline is insufficient, whether candidates are accepting offers, and whether recent hires are producing acceptable early outcomes. Supporting metrics can remain available without competing for attention on the primary dashboard.
Build one recruitment view from operational data to executive insight
The strongest recruitment dashboards are connected directly to the workflows that generate their data. Candidate applications, stage movements, interviews, assessments, offers, rejections, withdrawals, and hires should feed reporting without requiring recruiters to duplicate information in separate spreadsheets. This reduces reporting effort and improves consistency between operational and executive views.
Access should also reflect different audiences. Recruiters need detailed pipeline information, hiring managers need visibility into their vacancies and candidates, while executives need aggregated trends and exceptions. Building these views from the same underlying recruitment data creates a common version of performance while avoiding a single dashboard overloaded with information for every stakeholder.
An Applicant Tracking System such as Zamdit can provide the foundation by centralizing jobs, candidates, pipelines, assessments, interviews, scorecards, offers, communications, and recruitment reporting. When operational activity and analytics exist in the same environment, organizations can move from simply counting recruitment activity to understanding performance.
The measure of an executive recruitment dashboard is ultimately whether it changes a decision. If leadership can identify a hiring risk earlier, redirect resources, challenge a bottleneck, adjust compensation, or prioritize a critical vacancy because the dashboard made the issue visible, it is doing its job. The goal is not to display more recruiting data. It is to turn recruitment data into a concise, trusted view of workforce delivery that executives have a reason to use.